[ad_1]

JamesBrey
Over the last couple of weeks, I have taken a closer look at major U.S.-based retailers, such as Home Depot (HD), Walmart (WMT), and Target (TGT). I concluded that the market has been getting somewhat ahead of itself and I assumed a wait-and-see approach, after I opened a small position in HD a while ago. My most recent retail roundup, in which I covered nine companies, brought my attention to Best Buy Co. (NYSE:BBY), a major U.S.-based electronics retailer with a market capitalization currently around $18 billion. From a larger distance, the company looks really promising and has all the aspects I want to see in a potential dividend growth investment:

- at least a narrow economic moat
- meaningful sales and earnings growth as well as solid cash flow conversion
- high returns on capital
- low capital expenditures
- debt in conservative relation to free cash flow
- a strong dividend growth track record
- a starting yield of 2%+
Since BBY meets all of these criteria, I thought a closer look was warranted – perhaps the company is a welcome addition to my dividend growth portfolio at current levels? After all, the shares are currently trading at a forward price-earnings ratio of under 13.
In this article, I will present the results of my recent due diligence and elaborate whether I would consider investing in the company at its current valuation. I also provide my opinion on the company’s upcoming Q2 results on Aug. 30.
Best Buy Overview
Best Buy is predominantly a retailer of consumer electronics, like computers, cameras, mobile phones, fitness products, home theaters, and appliances. However, the company also sells health-related products and offers related services. To strengthen its at-home health services business, the company acquired Critical Signal Technologies and BioSensics‘ predictive health technology business (wearable sensors for clinical trials, patient monitoring and health assessment) in fiscal 2020. In fiscal 2022, Best Buy acquired Current Health, among others. I think these are very shrewd acquisitions for a mostly unspectacular electronics retailer.
As of fiscal 2022, the company had operations in the U.S. and in Canada. Best Buy announced the exit of its operations in Mexico in November 2020. Its international segment is now comparatively small, with fiscal 2022 (ended January 2022) revenues of $3.9 billion and operating income of $244 million. Its domestic segment was responsible for $47.8 billion in revenues in fiscal 2022 (92% of total revenues) and generated $2.8 billion in operating income (8% of total operating income). The international segment’s store footprint is relatively larger in relation to sales and operating income, i.e., the company operated 14% of its stores outside the United States.
Primarily due to increasing competition from online retailers such as Amazon (AMZN), Best Buy downsized its store portfolio in a way that I would describe as appropriate. As a result, lease obligations declined significantly, e.g., from $4.0 billion at the end of fiscal 2015 to $2.9 billion at the end of fiscal 2022.
The company had major international operations in Europe in the past and also operated a few stores in China and Turkey. The development of Best Buy’s worldwide store footprint is illustrated in Figure 1. As a potential investor, I’m pleased to see that the company has significantly scaled down its operations and is now focusing on only two markets, the U.S. and Canada. This way, there’s less geographic diversification, but in return, the company’s operations are more efficient and currency risk can now be considered insignificant as the U.S. and Canadian dollars are largely in lockstep and Best Buy is no longer exposed to the Mexican peso or the Turkish lira – two currencies notorious for their weakness. As an aside, the euro also is becoming what could be termed a weak currency of sorts, as the ECB recently announced the Transmission Protection Instrument, which I expect will further erode the quality of its balance sheet. So, it does not bother me that Best Buy pulled out of Europe a long time ago, but of course I’m not suggesting that the company wound down its European operations because of the currency risk involved. The current developments were not foreseeable in 2013 – at least not to their full extent.
Due to the company’s transition and exit of its operations in Europe, and the presentation of related results as discontinued operations until the end of fiscal 2014 (and to a very small extent even in fiscal 2015), I will analyze Best Buy’s past financial performance between fiscal 2015 and fiscal 2022.
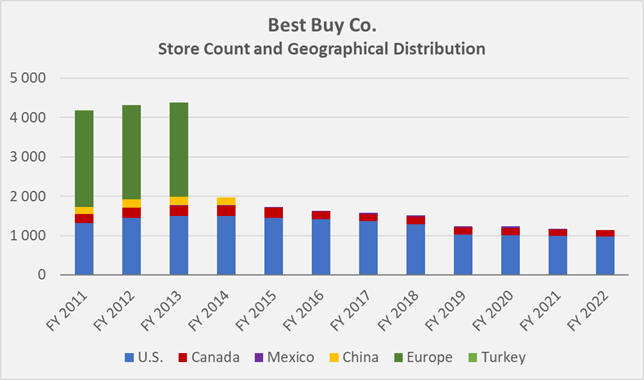
Figure 1: Historical count and geographical distribution of Best Buy stores (own work, based on the company’s fiscal 2011 to fiscal 2022 10-Ks)
Profitability and Growth
Margins are the lifeblood of a business – and this is especially true for retail companies, which by their very nature operate with relatively low margins. The segment is highly competitive, both online and offline. Large competitors such as Walmart (WMT), for example, benefit from far greater economies of scale and highly efficient logistics networks, as well as a much more diverse selection of goods and associated cross-selling tailwinds. Walmart and Co. also typically offer the convenience of gas stations or pharmacy offerings, creating a “one-stop store” experience that retailers like Best Buy cannot provide.
As such, it initially struck me negatively that Best Buy’s gross margin is in the low 20% range, and therefore even lower than that of Walmart. Considering that Best Buy is considerably smaller in terms of sales, its earnings can be expected to be more sensitive to external events.
The degree of earnings volatility is best analyzed via the degree of operating leverage, which characterizes a company’s ability to leverage fixed costs or expenses to generate returns. While companies with high degrees of operating leverage generate relatively higher earnings with a relatively small increase in sales, such companies typically show disproportionately declining earnings when sales decline. Contrary to intuition, Best Buy’s degree of operating leverage (Figure 2) has been relatively modest in recent years – on par with TGT (three-year average of 2.8) and even lower than WMT’s operating leverage ratio (three-year average of 3.8). This is a sign of strong execution and puts the relatively low gross margin in a different light.
Of course, since the degree of operating leverage is based on operating income, which is fairly easy to manage, it’s important to consider cash earnings as well. However, even after conservatively adjusting free cash flow for stock-based compensation, recurring impairment charges, and working capital account movements, Best Buy’s free cash flow remains strong – the company typically achieves a free cash flow conversion of 80% to 100% of operating income.
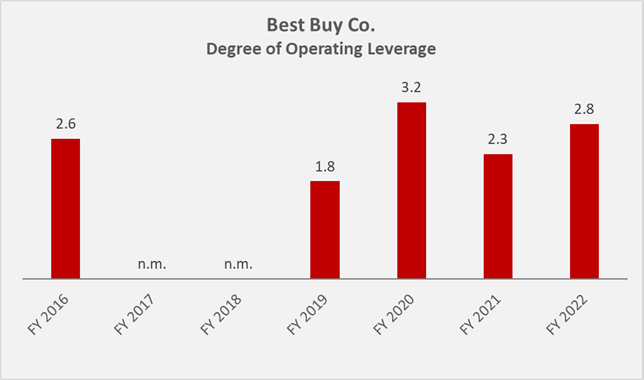
Figure 2: Best Buy’s historical degree of operating leverage; n.m. stands for not meaningful (own work, based on the company’s fiscal 2015 to fiscal 2022 10-Ks)
As shown later, not only is Best Buy’s degree of operating leverage relatively modest, but the company’s earnings are not overly sensitive to changes in interest rates. Therefore, I would not overstate the company’s relatively low gross and operating margins (Figure 3). Competitors such as TGT and WMT are currently working through their excess inventories and are having to mark down many goods in the process, leading to a decline in gross margin (e.g., by 430 basis points at TGT in 1Q2022). Best Buy, on the other hand, does not suffer from excess inventory, as evidenced by a year-over-year increase of less than 10% in Q1 of fiscal 2023. As a result, gross margin remained very stable this quarter at 22.1%. Since fiscal 2015, the company’s gross margin had a standard deviation of only 59 basis points – a truly outstanding performance.
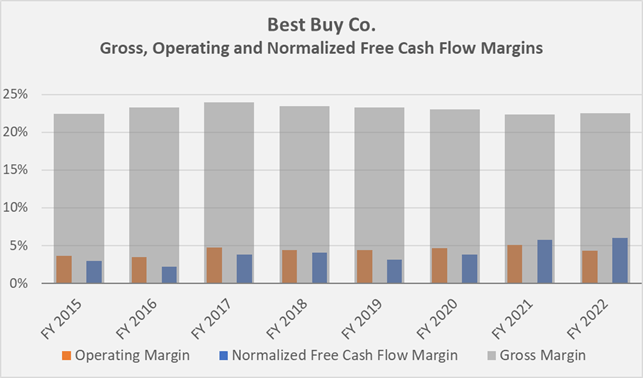
Figure 3: Best Buy’s historical margins (own work, based on the company’s fiscal 2015 to fiscal 2022 10-Ks)
Since it all comes down to cold, hard cash in the end, investors should take a closer look at Best Buy’s free cash flow margin. Since fiscal 2015, it has virtually doubled – while Best Buy’s revenue “only” grew at a compound annual growth rate of 3.6%, normalized free cash flow (nFCF) grew at a CAGR of nearly 15%. This, of course, raises the question of whether the company’s performance in fiscal 2021 and fiscal 2022 was an anomaly. Of course, it’s easy to dismiss the company’s improved cash flow efficiency as the result of unsustainable pricing policies in the context of rising consumer price inflation. But if that had been the case, I would have expected revenue growth to be much more in line with free cash flow growth. Instead, investors should commend management for relentlessly focusing on improving the company’s working capital management. Best Buy’s cash conversion cycle has fallen from 14 days in fiscal 2015 to negative three days in fiscal 2022 due to significantly improved payment terms with its customers while maintaining favorable payment terms with its suppliers and a very consistent inventory management. Unlike many other retailers, Best Buy has a notable accounts receivable balance, typically around 10% of working capital.
Therefore, it seems reasonable to assume that the company is able to maintain its good free cash flow productivity from an operating perspective, which – in addition to its well-managed asset base – is responsible for a continued strong excess return on invested capital (CROIC), with the exception of fiscal 2016 (Figure 4). In that year, the company had restructuring-related expenses of more than $200 million, which I have deducted in normalizing free cash flow, as Best Buy appears to be in an ongoing restructuring process. However, in other years, restructuring-related expenses were hardly significant.
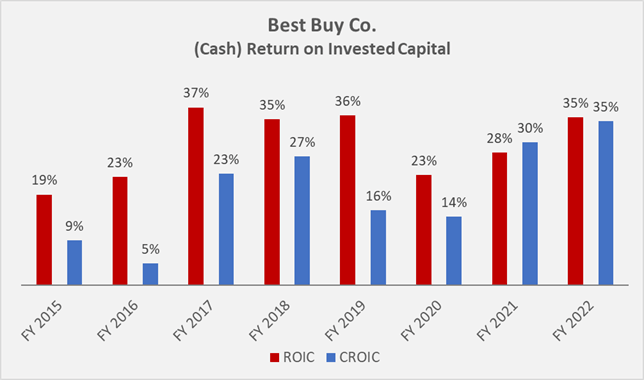
Figure 4: Best Buy’s historical (cash) return on invested capital (own work, based on the company’s fiscal 2015 to fiscal 2022 10-Ks)
Balance Sheet Quality and Dividend Safety
As a conservative, long-term investor who focuses on growing income through dividends, only companies with strong balance sheets are worth considering. In this regard, Best Buy really shines. As will be shown, the company’s balance sheet is rock solid, and even when lease obligations are included, the company is on very solid footing. I think this is another sign of strong management skills because it’s important to remember that the company has had to fight windmills in the past – first against stiff competition from online retailers like Amazon (AMZN), which was later exacerbated by pandemic closures that proved to be a tailwind for online retailers with a natural advantage in direct-to-consumer sales.
Notably, BBY, quite unlike Bed Bath & Beyond (BBBY), did not engage in the deadly race to the bottom in terms of profit margins, as shown in the previous section. The latter company’s management has made serious mistakes in the past, such as assuming large amounts of debt to fund stock buybacks near all-time highs while generously handing out discounts to consumers to keep sales stable. Profit margins plummeted, and with the catalyst of the pandemic and management’s foolish decision to undertake another round of share buybacks in fiscal 2020 and fiscal 2021 (p. 46, fiscal 2021 10-K), the company is now acutely threatened with insolvency, as I noted in my recent analysis.
Thanks to BBY’s management skills and relentless focus on maintaining an appropriate store size, the company’s balance sheet is completely unscathed after what has certainly been a turbulent period. The company had $13 million in long-term debt maturing within one year and $1.2 billion in long-term debt on its balance sheet at the end of fiscal 2022. With a three-year average annual normalized cash flow (nFCF) of $2.5 billion, the company could repay its financial debt in less than six months if it suspended buybacks and dividends. However, the company had a sizable $2.9 billion in cash and cash equivalents on its balance sheet at the end of fiscal 2022, leaving it with a net cash balance of about $1.5 billion. This figure should be taken with a grain of salt, of course, as retailers’ working capital and cash balances tend to fluctuate widely due to the seasonality of the business. At the end of the first quarter of fiscal 2023, the company’s cash position had fallen to $640 million – contrary to intuition and what has been seen at other retailers, Best Buy has not aggressively increased its inventory (up just 5% quarter-over-quarter to $6.26 billion), but has reduced its accounts payable by $1.3 billion. As a result, the company had negligible net debt of about $600 million at the end of the first quarter.
Given Best Buy’s low level of debt, it’s not surprising that the company’s interest coverage ratio, as measured by pre-interest nFCF, is very high (Figure 5). It should be noted, however, that the comparison of interest payments to pre-interest nFCF is not entirely accurate, as it does not take into account a potential tax shield effect. However, due to Best Buy’s low interest obligation, the contribution is negligible in any case.
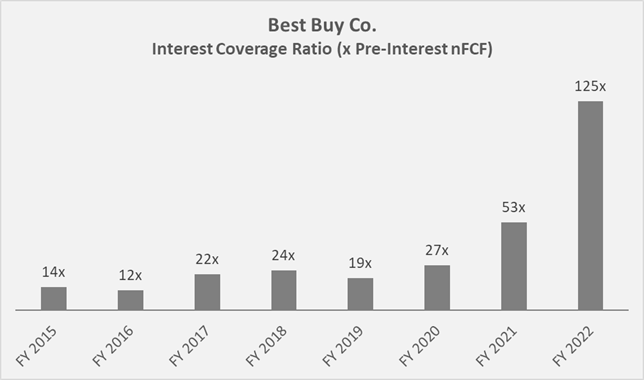
Figure 5: Best Buy’s historical interest coverage ratio in terms of pre-interest normalized free cash flow (own work, based on the company’s fiscal 2015 to fiscal 2022 10-Ks)
The company’s manageable long-term debt obligations do not require much discussion – Best Buy had only $500 million and $650 million of bonds outstanding at the end of fiscal 2022, maturing in 2028 and 2030, respectively. The bonds, which have been rated BBB+ with stable outlook by Standard & Poor’s (p. 31, fiscal 2022 10-K), entitle holders to annual interest payments of 4.45% and 1.95%, respectively, for a weighted average interest rate of 3.04%. This suggests that Best Buy is well protected against rising interest rates, even taking into account the maturity dates. Given that the company significantly reduced working capital related liabilities in the first quarter, a reversal of the mean is a reasonable expectation. Best Buy typically has a large amount of cash and short-term investments, so it should actually benefit from rising interest rates. Over the past three years, when interest rates have been very low, the company has generated $95 million in investment-related income while spending $141 million on interest expense. Potential BBY investors also should take a look at the company’s real estate portfolio, which is valued on the balance sheet at cost ($671 million at the end of fiscal 2022) and is likely worth much more.
Best Buy’s lease profile is similarly unspectacular (Figure 6). The company’s total undiscounted lease obligations at the end of fiscal 2022 were $2.9 billion, of which 1.5% are finance leases. 25% of the lease contracts are due in fiscal 2023 and 22% in fiscal 2024. It’s evident that the company operates on highly flexible lease terms.
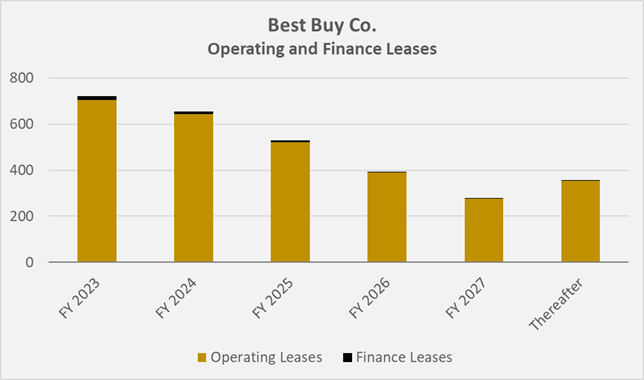
Figure 6: Best Buy’s lease profile at the end of fiscal 2022 (own work, based on the company’s fiscal 2022 10-Ks)
Given these considerations, it almost goes without saying that the dividend paid by Best Buy is very safe. The stock currently offers a yield of 4.7% (as of August 26), which is certainly enticing. In fiscal 2022, the company paid out less than 30% of its three-year average nFCF (conservatively factoring in the probably disproportionately high free cash flows in fiscal 2021 and 2022). Therefore, it’s not surprising that Best Buy has increased its dividend at a CAGR of 20% since fiscal 2015, and the recent increase of nearly 26% is also a strong indication of management’s confidence in the business.
Best Buy also engages in share buybacks, but of course does not sacrifice its balance sheet to do so. Since fiscal 2015, the company’s diluted weighted average shares outstanding have declined from 354 million to 249 million, resulting in a 42% earnings per share boost over that period. Taking a conservative view, and assuming that free cash flow could be lower if the current inflationary environment persists, investors should be cautious when extrapolating past earnings per share growth into the future. However, management has clearly not engaged in what some call “financial engineering.”
What To Expect From Best Buy’s Q2 Earnings And Beyond?
For Q2 of fiscal 2023, the company expects a decline in comparable sales, which will naturally lead to lower free cash flow. The expected year-over-year sales decline of approximately 13% appears startling at first glance and is difficult to digest after comparable sales increased nearly 20% year-over-year in Q2 of fiscal 2022. However, it’s important to keep in mind that most of last year’s increase was due to recovery from the pandemic, and the projected quarterly sales of $10.3 billion are still well above the pre-pandemic second quarter (i.e., 7.5%). Consumers already are feeling the pinch of rising inflation rates in their pockets, and it does not seem unreasonable to assume that many consumers have already shifted to a more frugal mindset, thereby deferring purchases of discretionary items. With that in mind, I do not think Best Buy’s revised forecast is really worrisome. The fact that the company expects significantly lower sales suggests that gross margin won’t take a big hit. It’s unlikely the company will engage in a race to the bottom in terms of margins, marking down a lot of inventory at the expense of gross margins. Nevertheless, it seems worth mentioning that CEO Corie Barry noted that deteriorating consumer sentiment is weighing on demand. Selling, general and administrative costs will rise, but the company has already announced job cuts to keep fixed costs under control.
I think it’s important to focus on the big picture here – Best Buy has successfully managed to defend its position in the consumer electronics sector and occupies a solid place alongside the major players and online-only retailers alike. It should be remembered that Best Buy also is in the healthcare services business through its – in my opinion – rather savvy acquisitions. Therefore, a reversion to the mean in sales and profits seems a reasonable long-term expectation as consumer price inflation moderates and consumer sentiment improves. Of course, a recession will hurt the company’s earnings and, more importantly, its stock price. But that kind of volatility is to be expected with a stock of a retailer, and Best Buy definitely has the resources to weather a storm. Long-term investors just need to be patient. Finally, after analyzing the stock’s performance following recent earnings reports from Walmart and Target, I would not wonder if Best Buy doesn’t surprise to the downside.
BBY Stock Valuation and Verdict
With a forward price-earnings ratio of below 13, the stock is certainly not expensive. According to Table 1, the stock is undervalued compared to the sector median, and also from a historical perspective. However, the comparison to historical valuations should be taken with a grain of salt as what we have witnessed in recent years was probably one of the strongest bull markets in history.
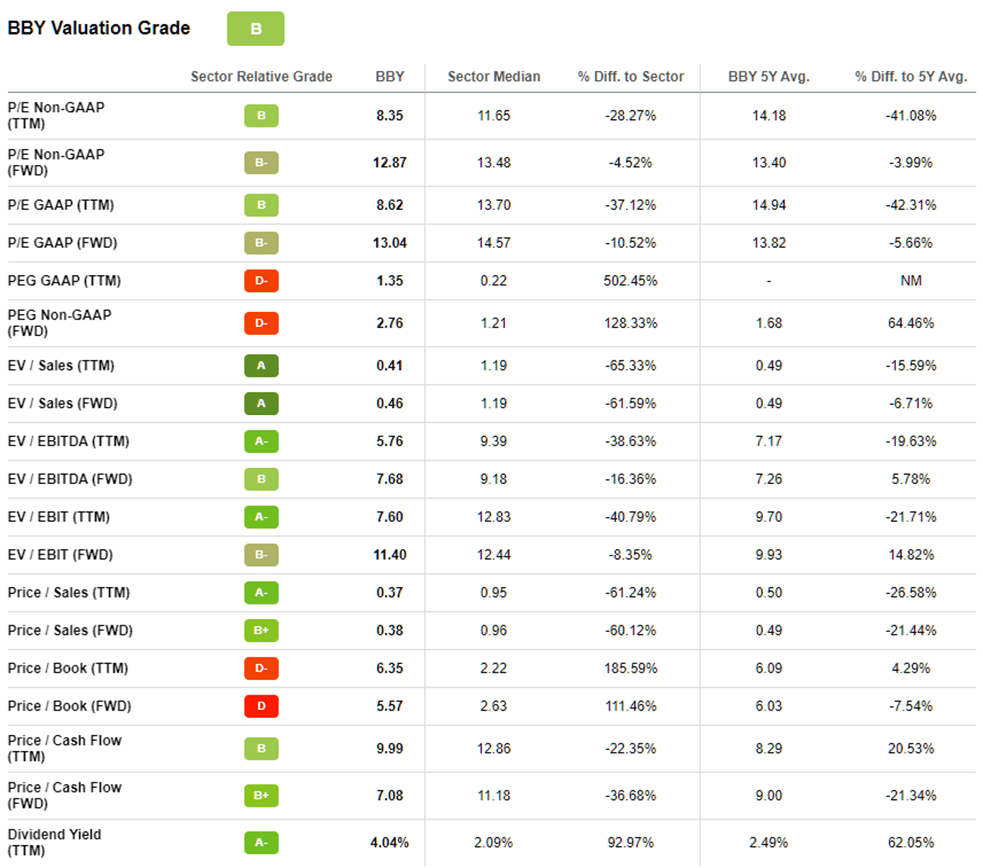
Table 1: Valuation metrics for Best Buy (taken from the valuation tab on BBY’s stock quote page on Seeking Alpha)
Plotting normalized free cash flow per share against share price (Figure 7), it’s also clear that the stock is currently undervalued – market participants expect cash earnings to decline. I would argue that the market – as always – is looking ahead and expects Best Buy to suffer greatly during a potential recession. Lower discretionary income also is a headwind for this company, which relies heavily on sales of discretionary items. However, at the current valuation, I believe the risks are fairly well priced into the stock, and I might even place a buy order shortly. After all, the company has already weathered several recessions and is looking back at a 20-year record of uninterrupted dividend growth. I usually place my buy orders after a company announces its earnings – but in the case of Best Buy, I think it’s unlikely that management will present a negative surprise on Tuesday, as it has already sandbagged its guidance recently and the market took the news quite optimistic.
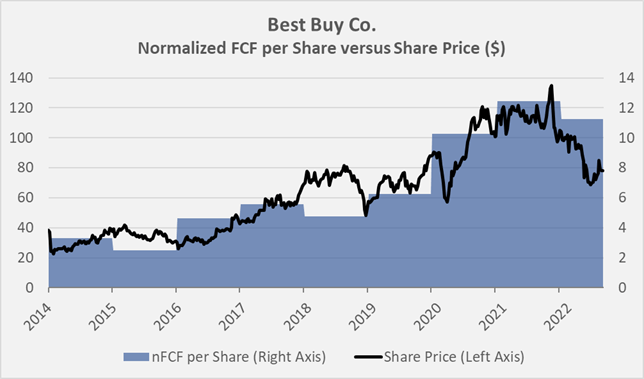
Figure 7: Overlay of Best Buy’s share price and normalized free cashflow per share (own work, based on the company’s fiscal 2015 to 2022 10-Ks, the weekly closing share price of BBY, and my own estimate of the company’s fiscal 2023 free cash flow)
Thank you very much for taking the time to read my article. In case of any questions or comments, I am very happy to read from you in the comments section below.
Source link