[ad_1]
Does the September share price for Life Healthcare Group Holdings Limited (JSE:LHC) reflect what it’s really worth? Today, we will estimate the stock’s intrinsic value by taking the expected future cash flows and discounting them to today’s value. The Discounted Cash Flow (DCF) model is the tool we will apply to do this. Before you think you won’t be able to understand it, just read on! It’s actually much less complex than you’d imagine.
We generally believe that a company’s value is the present value of all of the cash it will generate in the future. However, a DCF is just one valuation metric among many, and it is not without flaws. If you want to learn more about discounted cash flow, the rationale behind this calculation can be read in detail in the Simply Wall St analysis model.

Check out our latest analysis for Life Healthcare Group Holdings
What’s The Estimated Valuation?
We are going to use a two-stage DCF model, which, as the name states, takes into account two stages of growth. The first stage is generally a higher growth period which levels off heading towards the terminal value, captured in the second ‘steady growth’ period. To begin with, we have to get estimates of the next ten years of cash flows. Where possible we use analyst estimates, but when these aren’t available we extrapolate the previous free cash flow (FCF) from the last estimate or reported value. We assume companies with shrinking free cash flow will slow their rate of shrinkage, and that companies with growing free cash flow will see their growth rate slow, over this period. We do this to reflect that growth tends to slow more in the early years than it does in later years.
A DCF is all about the idea that a dollar in the future is less valuable than a dollar today, so we discount the value of these future cash flows to their estimated value in today’s dollars:
10-year free cash flow (FCF) forecast
| 2023 | 2024 | 2025 | 2026 | 2027 | 2028 | 2029 | 2030 | 2031 | 2032 | |
| Levered FCF (ZAR, Millions) | R2.52b | R3.66b | R4.15b | R4.66b | R5.18b | R5.73b | R6.31b | R6.92b | R7.58b | R8.28b |
| Growth Rate Estimate Source | Analyst x2 | Analyst x1 | Est @ 13.57% | Est @ 12.19% | Est @ 11.22% | Est @ 10.54% | Est @ 10.07% | Est @ 9.74% | Est @ 9.5% | Est @ 9.34% |
| Present Value (ZAR, Millions) Discounted @ 16% | R2.2k | R2.7k | R2.7k | R2.6k | R2.5k | R2.4k | R2.3k | R2.2k | R2.0k | R1.9k |
(“Est” = FCF growth rate estimated by Simply Wall St)
Present Value of 10-year Cash Flow (PVCF) = R23b
We now need to calculate the Terminal Value, which accounts for all the future cash flows after this ten year period. The Gordon Growth formula is used to calculate Terminal Value at a future annual growth rate equal to the 5-year average of the 10-year government bond yield of 9.0%. We discount the terminal cash flows to today’s value at a cost of equity of 16%.
Terminal Value (TV)= FCF2032 × (1 + g) ÷ (r – g) = R8.3b× (1 + 9.0%) ÷ (16%– 9.0%) = R134b
Present Value of Terminal Value (PVTV)= TV / (1 + r)10= R134b÷ ( 1 + 16%)10= R31b
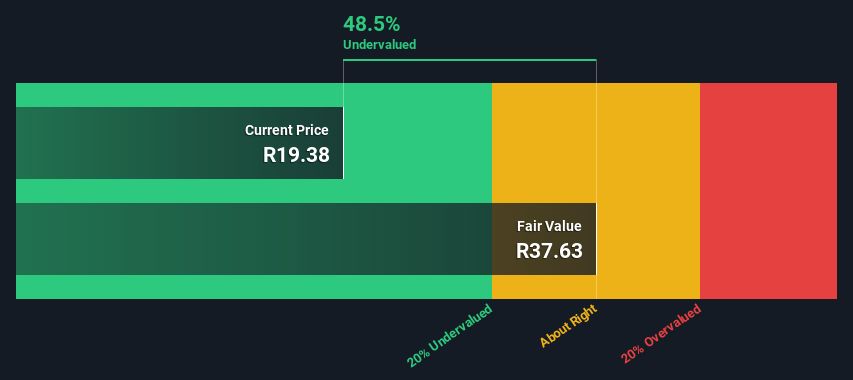
The total value is the sum of cash flows for the next ten years plus the discounted terminal value, which results in the Total Equity Value, which in this case is R55b. To get the intrinsic value per share, we divide this by the total number of shares outstanding. Relative to the current share price of R19.4, the company appears quite good value at a 49% discount to where the stock price trades currently. Valuations are imprecise instruments though, rather like a telescope – move a few degrees and end up in a different galaxy. Do keep this in mind.
Important Assumptions
The calculation above is very dependent on two assumptions. The first is the discount rate and the other is the cash flows. If you don’t agree with these result, have a go at the calculation yourself and play with the assumptions. The DCF also does not consider the possible cyclicality of an industry, or a company’s future capital requirements, so it does not give a full picture of a company’s potential performance. Given that we are looking at Life Healthcare Group Holdings as potential shareholders, the cost of equity is used as the discount rate, rather than the cost of capital (or weighted average cost of capital, WACC) which accounts for debt. In this calculation we’ve used 16%, which is based on a levered beta of 0.933. Beta is a measure of a stock’s volatility, compared to the market as a whole. We get our beta from the industry average beta of globally comparable companies, with an imposed limit between 0.8 and 2.0, which is a reasonable range for a stable business.
Moving On:
Valuation is only one side of the coin in terms of building your investment thesis, and it shouldn’t be the only metric you look at when researching a company. It’s not possible to obtain a foolproof valuation with a DCF model. Preferably you’d apply different cases and assumptions and see how they would impact the company’s valuation. For instance, if the terminal value growth rate is adjusted slightly, it can dramatically alter the overall result. Can we work out why the company is trading at a discount to intrinsic value? For Life Healthcare Group Holdings, there are three further factors you should further research:
- Risks: Every company has them, and we’ve spotted 1 warning sign for Life Healthcare Group Holdings you should know about.
- Future Earnings: How does LHC’s growth rate compare to its peers and the wider market? Dig deeper into the analyst consensus number for the upcoming years by interacting with our free analyst growth expectation chart.
- Other High Quality Alternatives: Do you like a good all-rounder? Explore our interactive list of high quality stocks to get an idea of what else is out there you may be missing!
PS. The Simply Wall St app conducts a discounted cash flow valuation for every stock on the JSE every day. If you want to find the calculation for other stocks just search here.
Have feedback on this article? Concerned about the content? Get in touch with us directly. Alternatively, email editorial-team (at) simplywallst.com.
This article by Simply Wall St is general in nature. We provide commentary based on historical data and analyst forecasts only using an unbiased methodology and our articles are not intended to be financial advice. It does not constitute a recommendation to buy or sell any stock, and does not take account of your objectives, or your financial situation. We aim to bring you long-term focused analysis driven by fundamental data. Note that our analysis may not factor in the latest price-sensitive company announcements or qualitative material. Simply Wall St has no position in any stocks mentioned.
Valuation is complex, but we’re helping make it simple.
Find out whether Life Healthcare Group Holdings is potentially over or undervalued by checking out our comprehensive analysis, which includes fair value estimates, risks and warnings, dividends, insider transactions and financial health.
Source link