[ad_1]
Today we will run through one way of estimating the intrinsic value of Al Meera Consumer Goods Company Q.P.S.C. (DSM:MERS) by taking the forecast future cash flows of the company and discounting them back to today’s value. We will use the Discounted Cash Flow (DCF) model on this occasion. Models like these may appear beyond the comprehension of a lay person, but they’re fairly easy to follow.
We would caution that there are many ways of valuing a company and, like the DCF, each technique has advantages and disadvantages in certain scenarios. For those who are keen learners of equity analysis, the Simply Wall St analysis model here may be something of interest to you.

Check out our latest analysis for Al Meera Consumer Goods Company Q.P.S.C
Is Al Meera Consumer Goods Company Q.P.S.C fairly valued?
We are going to use a two-stage DCF model, which, as the name states, takes into account two stages of growth. The first stage is generally a higher growth period which levels off heading towards the terminal value, captured in the second ‘steady growth’ period. To begin with, we have to get estimates of the next ten years of cash flows. Where possible we use analyst estimates, but when these aren’t available we extrapolate the previous free cash flow (FCF) from the last estimate or reported value. We assume companies with shrinking free cash flow will slow their rate of shrinkage, and that companies with growing free cash flow will see their growth rate slow, over this period. We do this to reflect that growth tends to slow more in the early years than it does in later years.
Generally we assume that a dollar today is more valuable than a dollar in the future, so we discount the value of these future cash flows to their estimated value in today’s dollars:
10-year free cash flow (FCF) estimate
| 2022 | 2023 | 2024 | 2025 | 2026 | 2027 | 2028 | 2029 | 2030 | 2031 | |
| Levered FCF (QAR, Millions) | ر.ق275.2m | ر.ق254.8m | ر.ق273.9m | ر.ق295.9m | ر.ق310.0m | ر.ق328.6m | ر.ق351.3m | ر.ق377.7m | ر.ق407.7m | ر.ق441.4m |
| Growth Rate Estimate Source | Analyst x1 | Analyst x1 | Analyst x1 | Analyst x1 | Est @ 4.75% | Est @ 6.02% | Est @ 6.9% | Est @ 7.52% | Est @ 7.95% | Est @ 8.25% |
| Present Value (QAR, Millions) Discounted @ 13% | ر.ق244 | ر.ق200 | ر.ق191 | ر.ق183 | ر.ق169 | ر.ق159 | ر.ق151 | ر.ق144 | ر.ق138 | ر.ق132 |
(“Est” = FCF growth rate estimated by Simply Wall St)
Present Value of 10-year Cash Flow (PVCF) = ر.ق1.7b
The second stage is also known as Terminal Value, this is the business’s cash flow after the first stage. For a number of reasons a very conservative growth rate is used that cannot exceed that of a country’s GDP growth. In this case we have used the 5-year average of the 10-year government bond yield (9.0%) to estimate future growth. In the same way as with the 10-year ‘growth’ period, we discount future cash flows to today’s value, using a cost of equity of 13%.
Terminal Value (TV)= FCF2031 × (1 + g) ÷ (r – g) = ر.ق441m× (1 + 9.0%) ÷ (13%– 9.0%) = ر.ق12b
Present Value of Terminal Value (PVTV)= TV / (1 + r)10= ر.ق12b÷ ( 1 + 13%)10= ر.ق3.7b
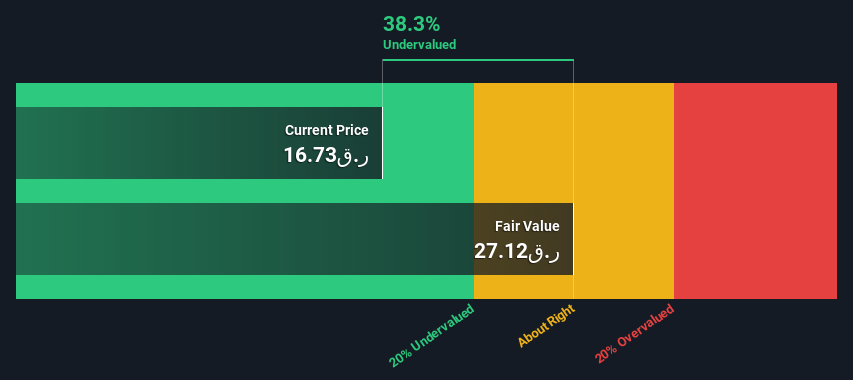
The total value, or equity value, is then the sum of the present value of the future cash flows, which in this case is ر.ق5.4b. To get the intrinsic value per share, we divide this by the total number of shares outstanding. Compared to the current share price of ر.ق16.7, the company appears quite undervalued at a 38% discount to where the stock price trades currently. The assumptions in any calculation have a big impact on the valuation, so it is better to view this as a rough estimate, not precise down to the last cent.
Important assumptions
Now the most important inputs to a discounted cash flow are the discount rate, and of course, the actual cash flows. Part of investing is coming up with your own evaluation of a company’s future performance, so try the calculation yourself and check your own assumptions. The DCF also does not consider the possible cyclicality of an industry, or a company’s future capital requirements, so it does not give a full picture of a company’s potential performance. Given that we are looking at Al Meera Consumer Goods Company Q.P.S.C as potential shareholders, the cost of equity is used as the discount rate, rather than the cost of capital (or weighted average cost of capital, WACC) which accounts for debt. In this calculation we’ve used 13%, which is based on a levered beta of 0.800. Beta is a measure of a stock’s volatility, compared to the market as a whole. We get our beta from the industry average beta of globally comparable companies, with an imposed limit between 0.8 and 2.0, which is a reasonable range for a stable business.
Moving On:
Whilst important, the DCF calculation shouldn’t be the only metric you look at when researching a company. The DCF model is not a perfect stock valuation tool. Preferably you’d apply different cases and assumptions and see how they would impact the company’s valuation. For instance, if the terminal value growth rate is adjusted slightly, it can dramatically alter the overall result. What is the reason for the share price sitting below the intrinsic value? For Al Meera Consumer Goods Company Q.P.S.C, we’ve compiled three further elements you should look at:
- Risks: To that end, you should be aware of the 1 warning sign we’ve spotted with Al Meera Consumer Goods Company Q.P.S.C .
- Future Earnings: How does MERS’s growth rate compare to its peers and the wider market? Dig deeper into the analyst consensus number for the upcoming years by interacting with our free analyst growth expectation chart.
- Other Solid Businesses: Low debt, high returns on equity and good past performance are fundamental to a strong business. Why not explore our interactive list of stocks with solid business fundamentals to see if there are other companies you may not have considered!
PS. The Simply Wall St app conducts a discounted cash flow valuation for every stock on the DSM every day. If you want to find the calculation for other stocks just search here.
Have feedback on this article? Concerned about the content? Get in touch with us directly. Alternatively, email editorial-team (at) simplywallst.com.
This article by Simply Wall St is general in nature. We provide commentary based on historical data and analyst forecasts only using an unbiased methodology and our articles are not intended to be financial advice. It does not constitute a recommendation to buy or sell any stock, and does not take account of your objectives, or your financial situation. We aim to bring you long-term focused analysis driven by fundamental data. Note that our analysis may not factor in the latest price-sensitive company announcements or qualitative material. Simply Wall St has no position in any stocks mentioned.
Source link